Visualize M3DB data with Grafana®#
Since M3DB is best for time series data, consisting of many individual metrics, then it’s nicer to visualize the data than try to view it in a table or log. Luckily, Aiven can set up the Grafana® and the integration between the two services for you.
Integrate M3DB and Grafana#
Log into Aiven Console and select your Aiven for M3DB service.
Click Integrations on the sidebar.
Select Monitor Data in Grafana.
Choose either a new service or existing service.
When creating a new service you will need to select the cloud, region and plan to use. You should also give your service a name. The service overview page shows the nodes rebuilding, and then indicates when they are ready.
If you’re already using Grafana on Aiven, you can integrate your M3DB as a data source for that existing Grafana.
Note
If you are a member of multiple Aiven projects with operator or admin access right, you need to choose the project first then your target Grafana services.
On the service overview page for your Grafana service, select Service URI link. The username and password for your Grafana service is also available on the service overview page.
Now your Grafana service is connected to M3DB as a data source and you can go ahead and visualize your data.
Visualizing M3DB data in Grafana#
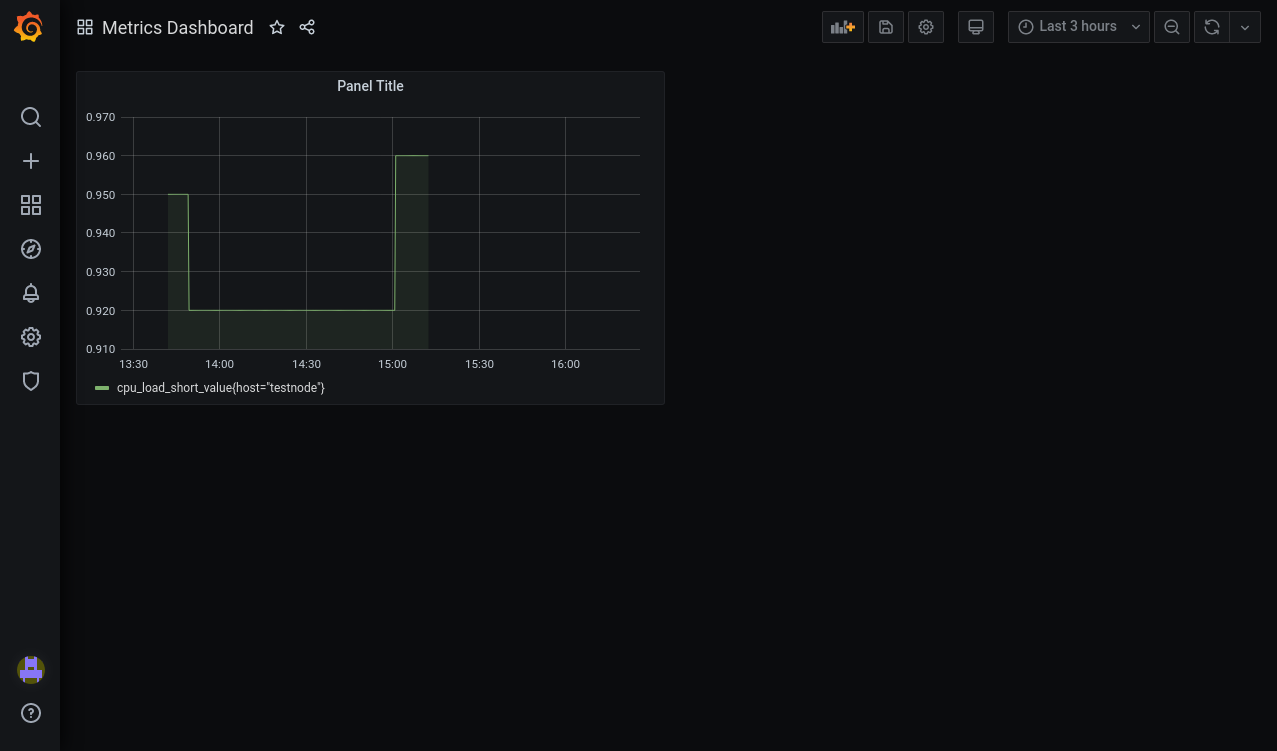
In Grafana, create a new dashboard and add a panel to it.
The datasource dropdown shows --Grafana-- by default, but your M3DB service will be listed here with a Prometheus logo. Prometheus is managing the communication between M3DB and Grafana.
With your M3DB service selected, the Query section will show the metrics from the database in its dropdown.
Tip
If no metrics are shown, check that there is data in the database
Once you are happy with your panel, give it a title and click Save in the top right hand corner.

To get to know Grafana better, try the Grafana Fundamentals page on the Grafana project site.

