Streaming anomaly detection with Apache Flink®, Apache Kafka® and PostgreSQL®#
What you will learn#
Follow this tutorial and you’ll learn how to build a streaming anomaly detection system. In particular, we’ll cover the following:
How to create a fake streaming dataset.
How to create and use Apache Kafka for data streaming.
How to create and use PostgreSQL® to store threshold data.
How to create and use Apache Flink® to define streaming data pipelines.
How to push the outcome of the anomaly detection system as a Slack notification.
What are you going to build#
Anomaly detection is a way to find unusual or unexpected things in data. It is immensely helpful in a variety of fields, such as fraud detection, network security, quality control and others. By following this tutorial you will build your own streaming anomaly detection system.
For example: a payment processor might set up anomaly detection against an e-commerce store if it notices that the store - which sells its items in Indian Rupees and is only configured to sell to the Indian market - is suddenly receiving a high volume of orders from Spain. This behavior could indicate fraud. Another example is that of a domain hosting service implementing a CAPTCHA against an IP address it deems is interacting with one of its domains in rapid succession.
While it’s often easier to validate anomalies in data once they due to be stored in the database, it’s more useful to check in-stream and address unwanted activity before it affects our dataset.
We can check for anomalies in data by creating filtering pipelines using Apache Fiink®. Apache Flink is a flexible, open source tool for in-stream and batch processing of data. It lets us run SQL-like queries against a stream of data and perform actions based on the results of those queries.
In this tutorial you’ll use a fake Internet of Things (IoT) sensor that generates data on a CPU usage for various devices as our continuous flow of data. Once the data is flowing, you’ll then create a basic filtering pipeline to separate the usage values surpassing a fixed threshold (80%).
This example mimics a scenario where you might want to separate and generate alerts for anomalies in single events. For instance, a sensor having a CPU utilization of 99% might create a heating problem and therefore you might want to notify the team in charge of the inventory to schedule the replacement.
However, receiving a notification on every sensor reading that surpasses a fixed threshold can be overwhelming and create false positives for short usage spikes. Therefore you’ll create a second, more advanced, pipeline to average the sensor readings values over 30 seconds windows and then compare the results with various thresholds, defined for every IoT device, and stored in a reference table.
Reading the average CPU value in 30 second windows will improve your initial implementation and help avoid false positive notifications for single spikes, but still let you flag components that are at potential risk of overheating. The threshold lookup enables a more precise definition of alert ranges depending on the device type.
The tutorial includes:
Apache Flink for data transformation.
Apache Kafka for data streaming.
PostgreSQL® for data storage/query.
Slack as notification system.
In this tutorial we’ll be using Aiven services, specifically Aiven for Apache Flink®, Aiven for Apache Kafka®, and Aiven for PostgreSQL®. All of these are open source tools widely available. We encourage you to sign up for a free trial to follow along as it will reduce any issues you might have with networking and getting services to communicate with each other to nearly zero.
Architecture overview#
To build near real-time anomaly detection system, you’ll build a streaming data pipeline that will be able to process the IoT sensor readings as soon as they are generated. The pipeline relies on two sources: the first source is an Apache Kafka topic that contains the fake stream of IoT metrics data and the second is a table in PostgreSQL® database containing alerting thresholds, defined for each IoT device. Then an Apache Flink® service combines the data, applies some transformation SQL to find the anomalies, and pushes the result to a separate Apache Kafka® topic or a Slack channel for team notification.
Prerequisites#
The tutorial uses Aiven services, therefore you’ll need a valid Aiven account. On top of the Aiven account, you will also need the following three items:
Docker, needed for the fake data generator for Apache Kafka. Check out the related installation instructions.
Slack App and Token: the data pipeline output is a notifications to a Slack channel, check out the needed steps to set up a Slack app and retrieve the Slack authentication token.
psql a terminal based tool to interact with PostgreSQL where the threshold data will be stored.
Create the Aiven services#
In this section you’ll create all the services needed to define the anomaly detection system via the Aiven Console:
An Aiven for Apache Kafka® named
demo-kafkafor data streaming, this is where the stream of IoT sensor readings will land.An Aiven for Apache Flink® named
demo-flinkfor streaming data transformation, to define the anomaly detection queries.An Aiven for PostgreSQL® named
demo-postgresqlfor alerting thresholds storage and query.
Create an Aiven for Apache Kafka® service#
The Aiven for Apache Kafka service is responsible for receiving the inbound stream of IoT sensor readings. Create the service with the following steps:
Log in to the Aiven web console.
On the Services page, click Create service.
This opens a new page with the available service options.
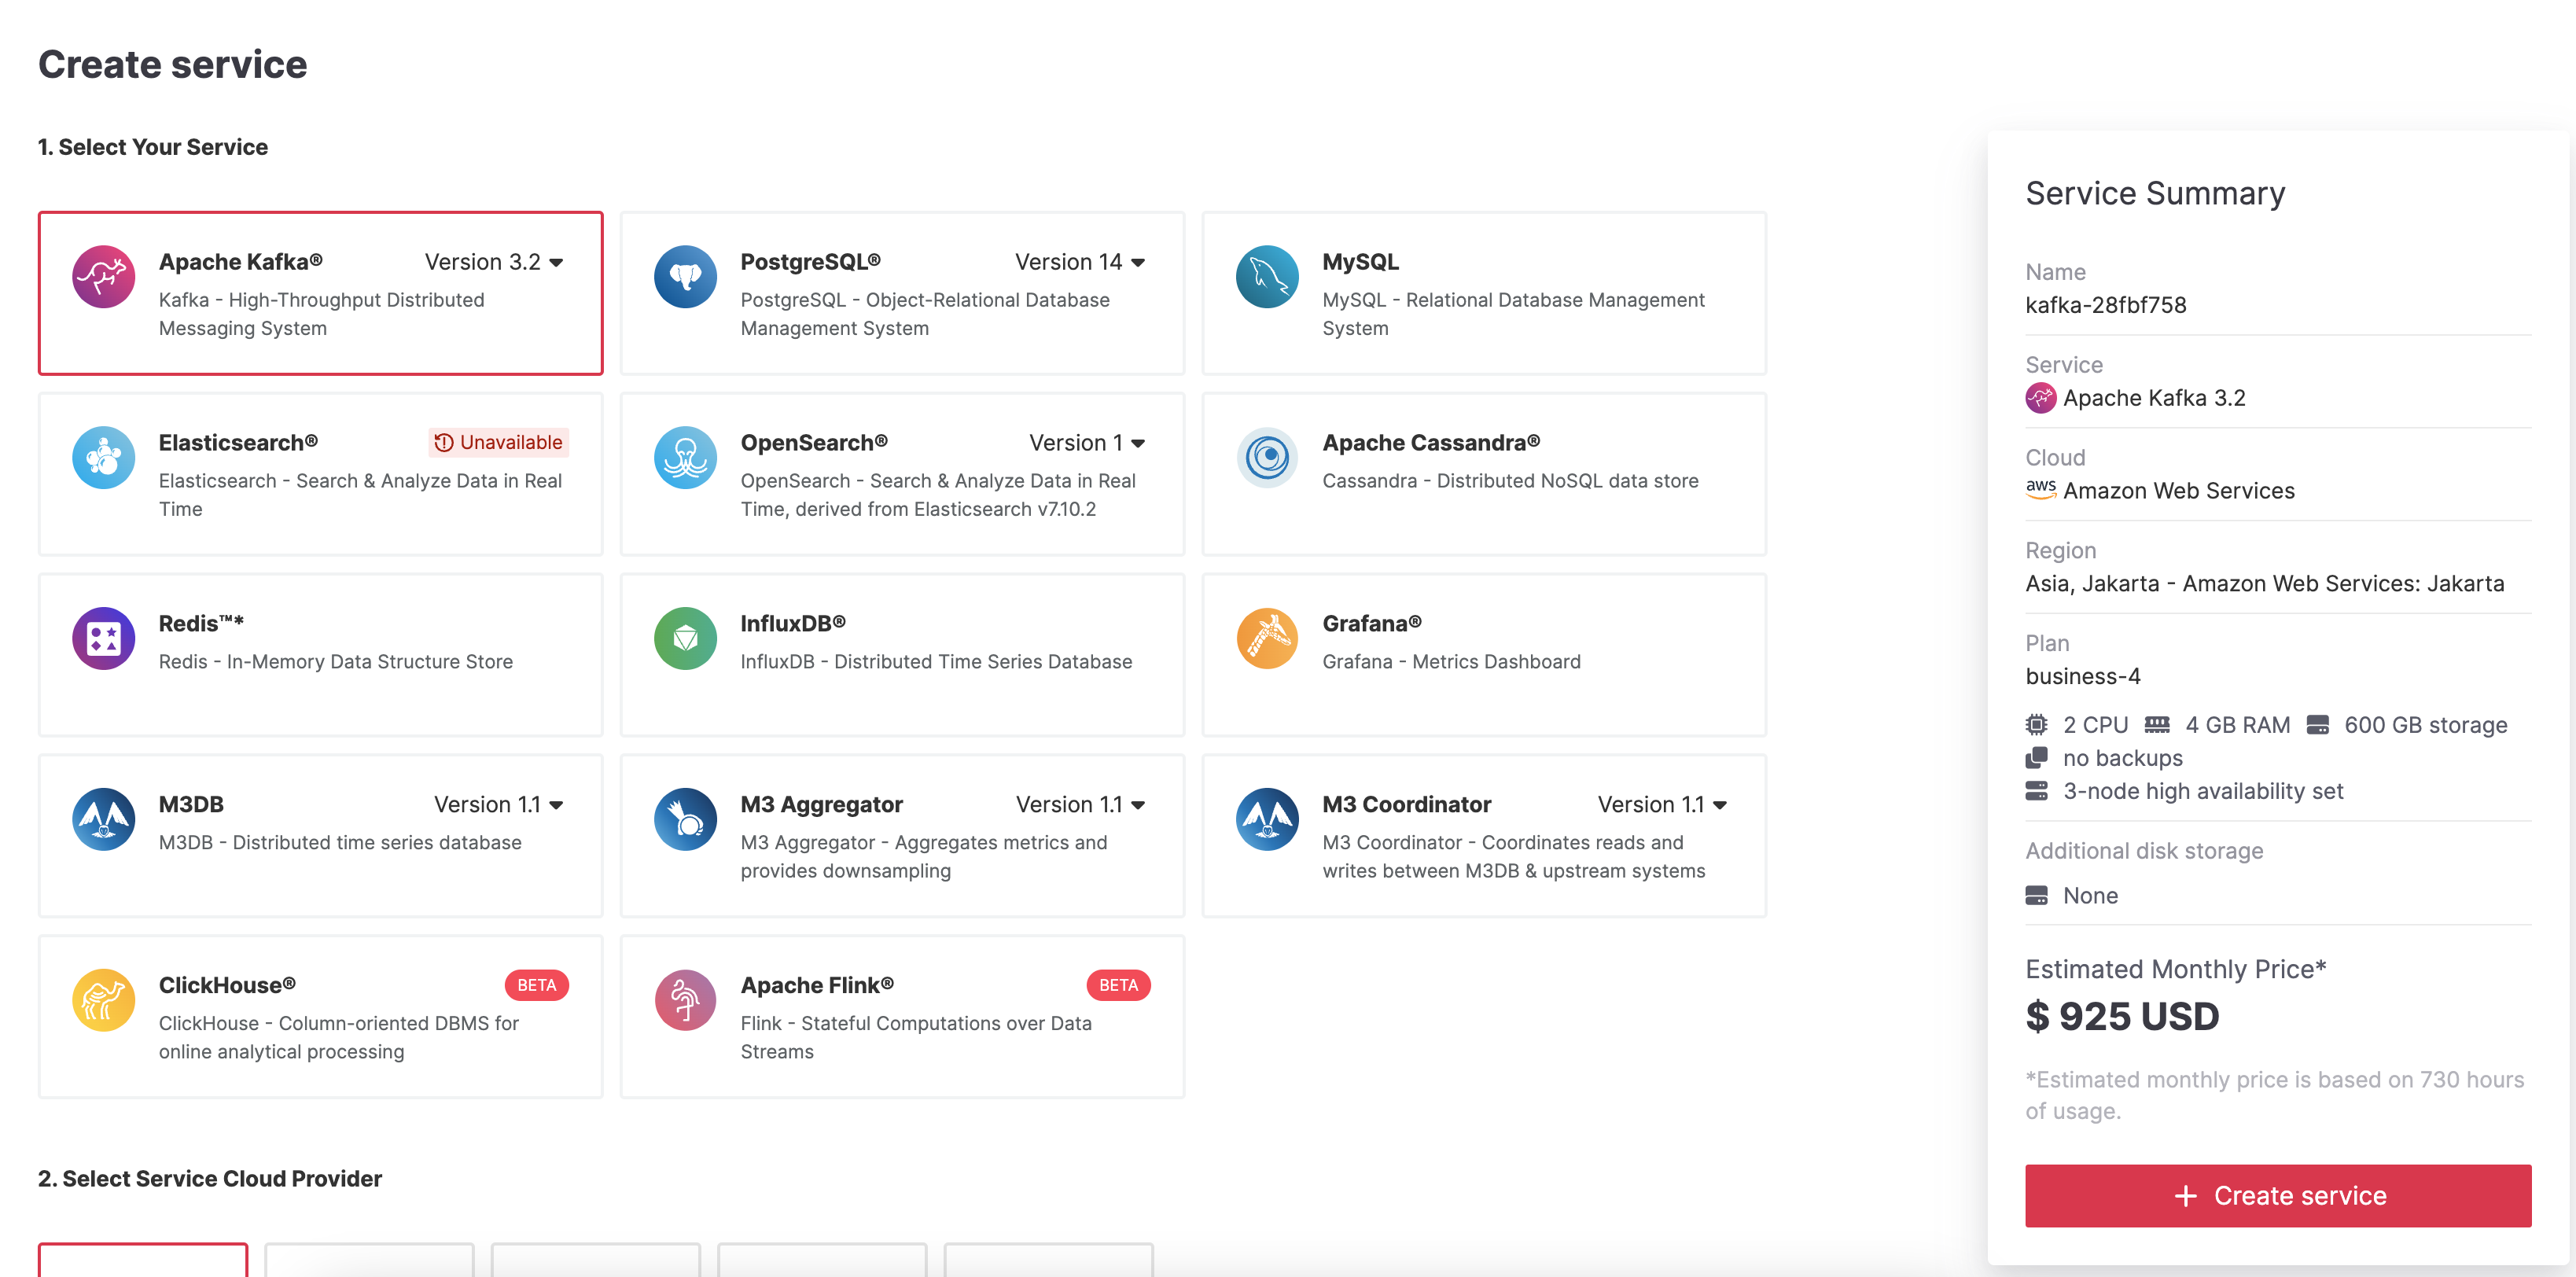
Select Apache Kafka®.
Select the cloud provider and region that you want to run your service on.
Select business-4 as service plan. The business-4 plan allows you to define the service integrations needed to define Apache Flink streaming transformations over the Apache Kafka topic.
Enter
demo-kafkaas name for your service.Click Create service under the summary on the right side of the console
Customise the Aiven for Apache Kafka service#
Now that your service is created, you need to customise its functionality. On the Service settings page of your freshly created service, you’ll see a bunch of toggles and properties. Change these two:
Enable the Apache Kafka REST APIs to manage and query via the Aiven Console.
Navigate to Service settings page > Service management section > actions (…) menu > Enable REST API (Karapace).
Enable the automatic creation of Apache Kafka topics to create new Apache Kafka® topics on the fly while pushing a first record.
Navigate to Service settings page > Advanced configuration section > Configure > Add configuration options >
kafka.auto_create_topics_enable, enable the selected parameter using the toggle switch, and select Save configuration.
Create an Aiven for PostgreSQL® service#
The PostgreSQL database is where you’ll store the threshold data for each IoT device. These thresholds represent the alerting range of each IoT device, e.g. a device might trigger an alert when the usage is over 90%, for other devices, the threshold should be 60%.
You can create the Aiven for PostgreSQL database with the following steps:
Log in to the Aiven web console.
On the Services page, click Create service.
Select PostgreSQL®.
Select the cloud provider and region that you want to run your service on.
Select Startup-4 as service plan. The Startup-4 plan allows you to define the service integrations needed to define Apache Flink streaming transformations over the data in the PostgreSQL® table.
Enter
demo-postgresqlas name for your service.Click Create service under the summary on the right side of the console
Create an Aiven for Apache Flink service#
The Apache Flink service is where you’ll define the streaming data pipelines to calculate and detect the anomalies.
You can create the Aiven for Apache Flink service with the following steps:
Log in to the Aiven web console.
On the Services page, click Create a new service.
Select Apache Flink®.
Select the cloud provider and region that you want to run your service on.
Select business-4 as service plan. The business-4 is the minimal plan available for Aiven for Apache Flink, enough to define all the data transformations in this tutorial.
Enter
demo-flinkas name for your service.Click Create Service under the summary on the right side of the console.
Integrate Aiven for Apache Flink service with sources and sinks#
After creating the service, you’ll be redirected to the service details page. Apache Flink doesn’t work in isolation, it needs data sources and sinks. Therefore you’ll need to define the integrations between Apache Flink service and:
Aiven for Apache Kafka®, which contains the stream of IoT sensor readings.
Aiven for PostgreSQL®, which contains the alerting thresholds.
You can define the service integrations, on the Aiven for Apache Flink® Overview page, with the following steps:
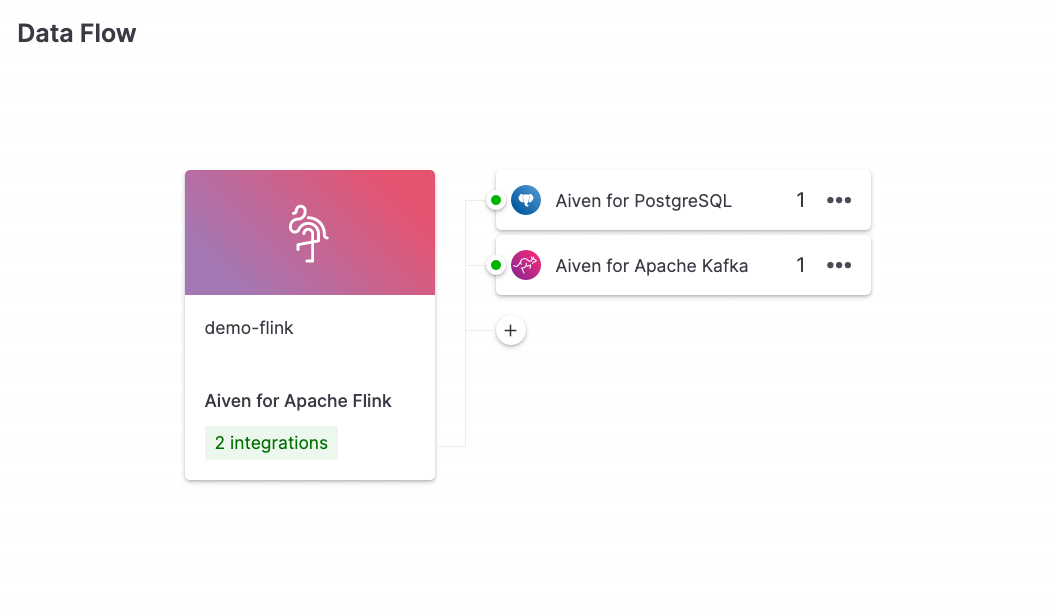
Select Create data pipeline in section Create and manage your data streams with ease at the top of the Overview page.
In the Data Service Integrations window, select the Aiven for Apache Kafka checkbox and, next, select the
demo-kafkaservice. Select Integrate.Back on the Overview page, in the Data Flow section, select the + icon.
In the Data Service Integrations window, select the Aiven for PostgreSQL checkbox and, next, select the
demo-postgresqlservice. Select Integrate.
Once the above steps are completed, your Data Flow section should be similar to the below:
Set up the IoT metrics streaming dataset#
Now that the plumbing of all the components is sorted, it’s time for you to create a continuous stream of fake IoT data that will land in an Aiven for Apache Kafka topic. There are various ways to generate fake data, for the tutorial you’ll use the Dockerized fake data producer for Aiven for Apache Kafka® allowing you to generate a continuous flow of data with a minimal setup.
Create an Aiven authentication token#
The Dockerized fake data producer for Aiven for Apache Kafka® requires an Aiven authentication token to fetch all the Apache Kafka connection parameters.
You can create an authentication token with the following steps:
Log in to the Aiven Console.
Click the user icon in the top-right corner of the page.
Click Tokens tab.
Click the Generate token button.
Enter a description (optional) and a time limit (optional) for the token. Leave the Max age hours field empty if you do not want the token to expire.
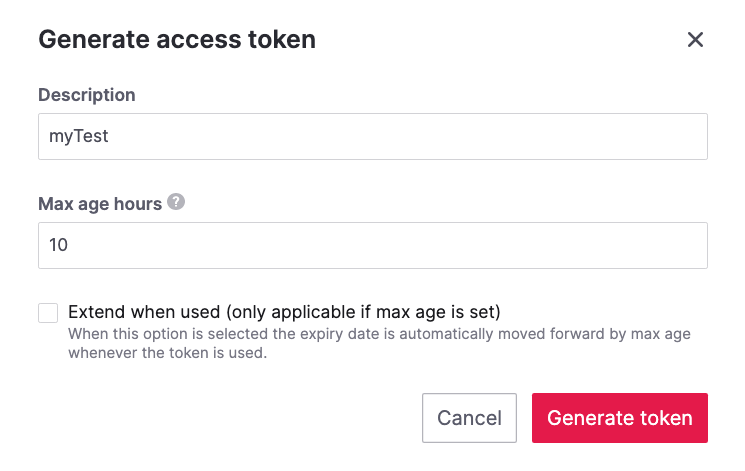
Click Generate token.
Click the Copy icon or select and copy the access token.
Note
You cannot get the token later after you close this view.
Store the token safely and treat this just like a password.
Click Close.
Start the fake IoT data generator#
It’s time to start streaming the fake IoT data that you’ll later process with with Apache Flink:
Note
You can also use other existing data, although the examples in this tutorial are based on the IoT sample data.
Clone the Dockerized fake data producer for Aiven for Apache Kafka® repository to your computer:
git clone https://github.com/aiven/fake-data-producer-for-apache-kafka-docker.git
Navigate in the to the
fake-data-producer-for-apache-kafka-dockerdirectory and copy theconf/env.conf.samplefile toconf/env.conf.Edit the
conf/env.conffile and update the following parameters:PROJECT_NAMEto the Aiven project name where your services have been created.SERVICE_NAMEto the Aiven for Apache Kafka service namedemo-kafka.TOPICtocpu_load_stats_real.NR_MESSAGESto0.Note
The
NR_MESSAGESoption defines the number of messages that the tool creates when you run it. Setting this parameter to0creates a continuous flow of messages that never stops.USERNAMEto the username used to login in the Aiven console.TOKENto the Aiven token generated at the previous step of this tutorial.
Note
See the Dockerized fake data producer for Aiven for Apache Kafka® instructions for details on the parameters.
Run the following command to build the Docker image:
docker build -t fake-data-producer-for-apache-kafka-docker .
Run the following command to run the Docker image:
docker run fake-data-producer-for-apache-kafka-docker
You should now see the above command pushing IoT sensor reading events to the
cpu_load_stats_realtopic in your Apache Kafka® service:{"hostname": "dopey", "cpu": "cpu4", "usage": 98.3335306302198, "occurred_at": 1633956789277} {"hostname": "sleepy", "cpu": "cpu2", "usage": 87.28240549074823, "occurred_at": 1633956783483} {"hostname": "sleepy", "cpu": "cpu1", "usage": 85.3384018012967, "occurred_at": 1633956788484} {"hostname": "sneezy", "cpu": "cpu1", "usage": 89.11518629380006, "occurred_at": 1633956781891} {"hostname": "sneezy", "cpu": "cpu2", "usage": 89.69951046388306, "occurred_at": 1633956788294}
Check the data in Apache Kafka#
To check if your fake data producer is running, head to Apache Kafka in the Aiven console and look for the cpu_load_stats_real topic:
Log in to the Aiven web console.
Click on the Aiven for Apache Kafka service name
demo-kafka.Click on the Topics from the left sidebar.
On the
cpu_load_stats_realline, select the...symbol and then click on Topic messages.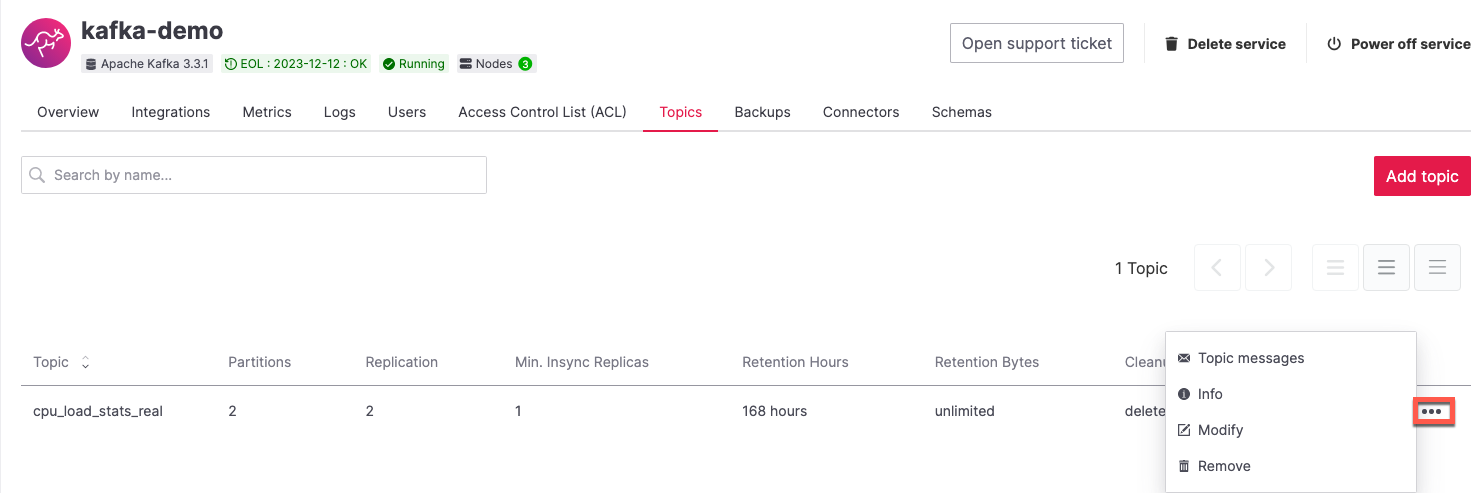
Click on the Fetch Messages button.
Toggle the Decode from base64 option.
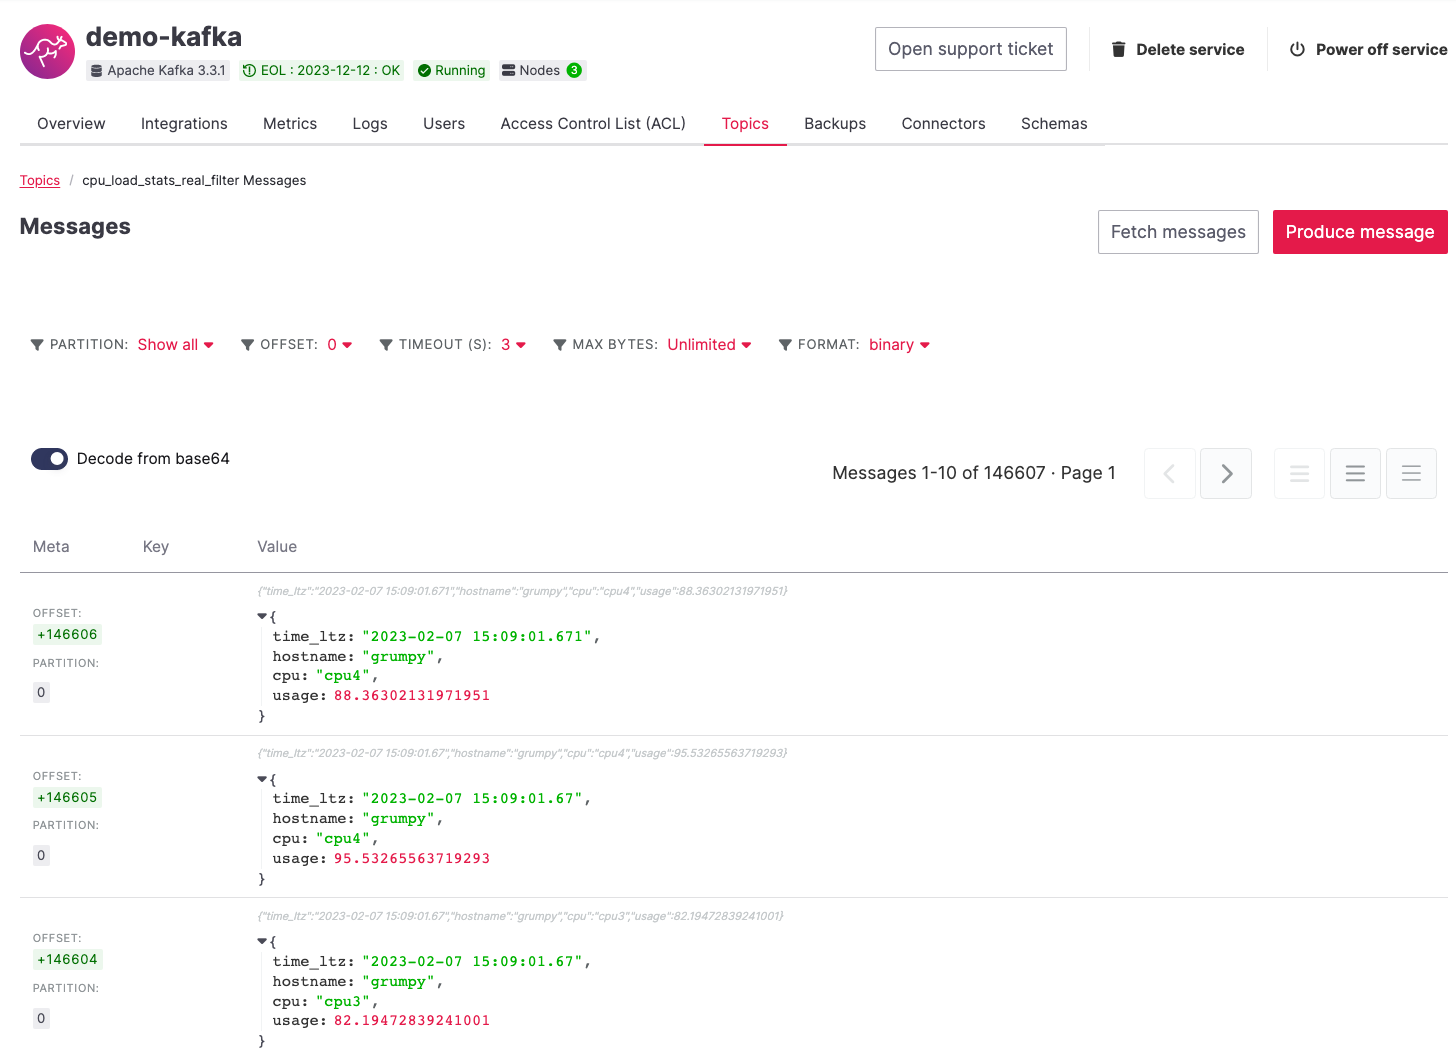
You should see the messages being pushed to the Apache Kafka topic:
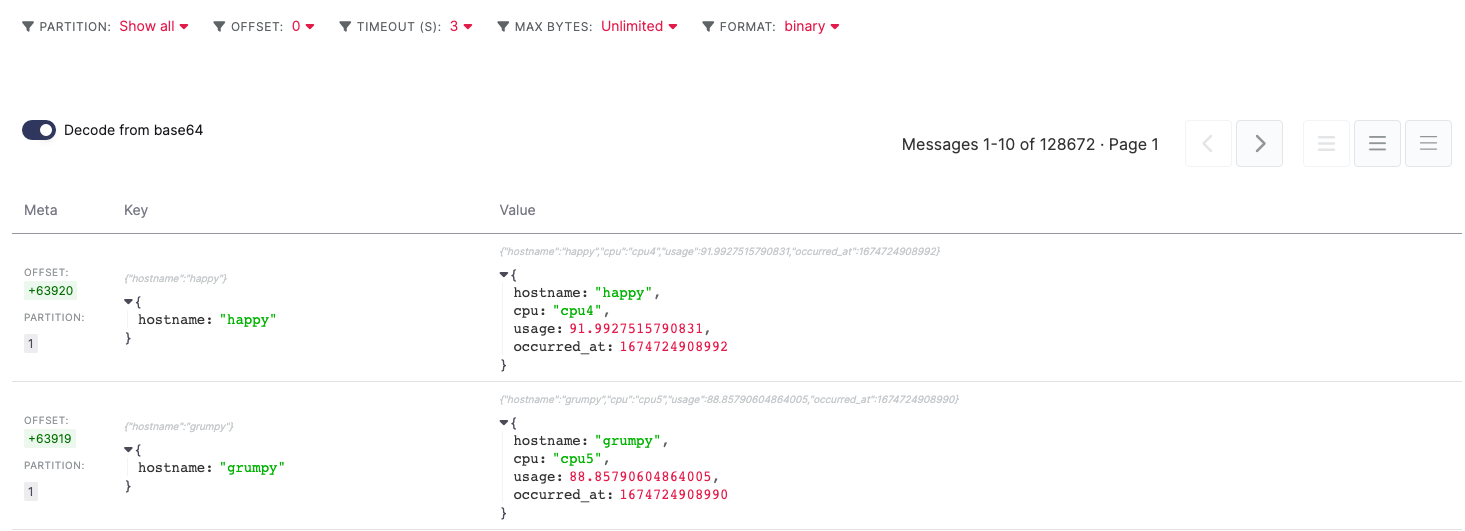
Click again on the Fetch Messages button to refresh the visualization with new messages.
Create a basic anomaly detection pipeline with filtering#
The first anomaly detection pipeline that you’ll create showcases a basic anomaly detection system: you want to flag any sensor reading exceeding a fixed 80% threshold since it could represent a heating anomaly. You’ll read the IoT sensor readings from the cpu_load_stats_real in Apache Kafka, build a filtering pipeline in Apache Flink, and push the readings above the 80% threshold back to Apache Kafka, but to a separate cpu_load_stats_real_filter topic.
The steps to create the filtering pipeline are the following:
Create a new Aiven for Apache Flink application.
Define a source table to read the metrics data from your Apache Kafka® topic.
Define a sink table to send the processed messages to a separate Apache Kafka® topic.
Define a SQL transformation definition to process the data.
Create an application deployment to execute the pipeline.
If you feel brave, you can go ahead and try try yourself in the Aiven Console. Otherwise you can follow the steps below:
In the Aiven Console, open the Aiven for Apache Flink service named
demo-flinkand go to the Applications from the left sidebar.Click Create new application to create your Flink application.
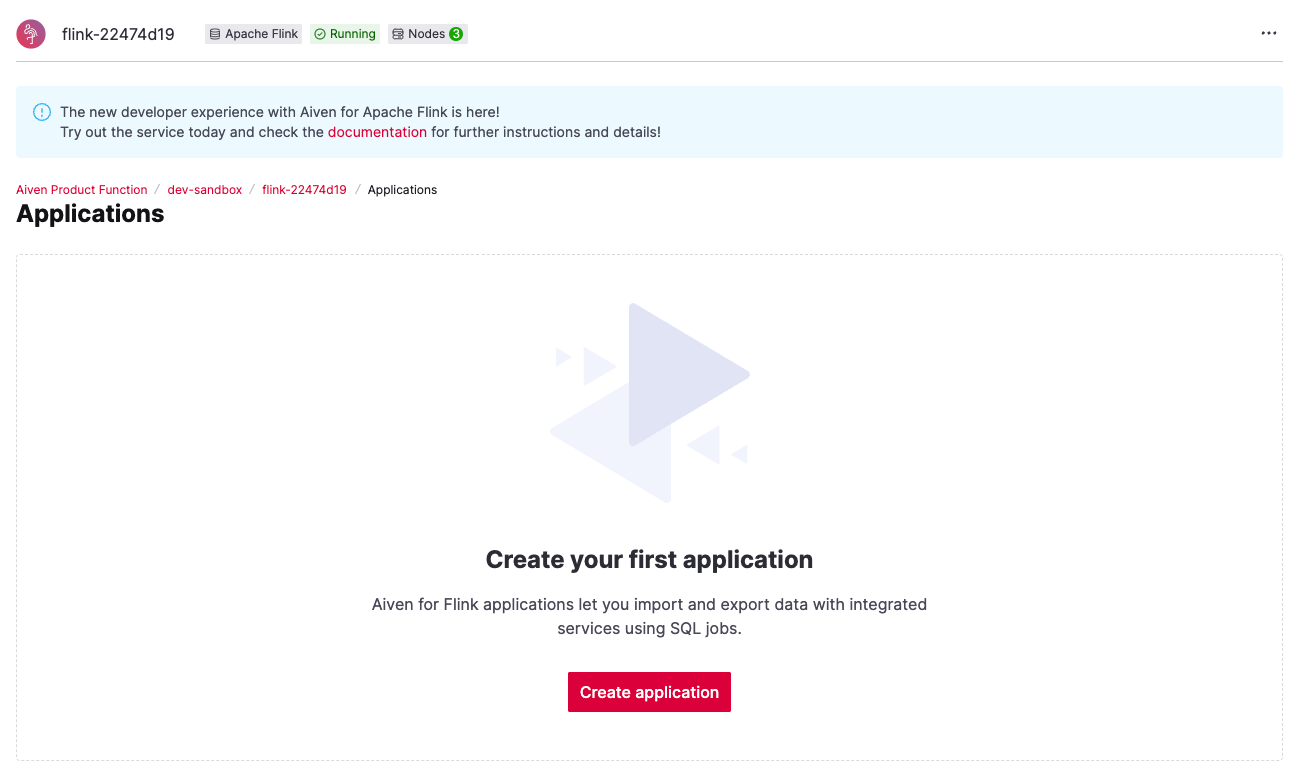
Name the new application
filteringand click Create application.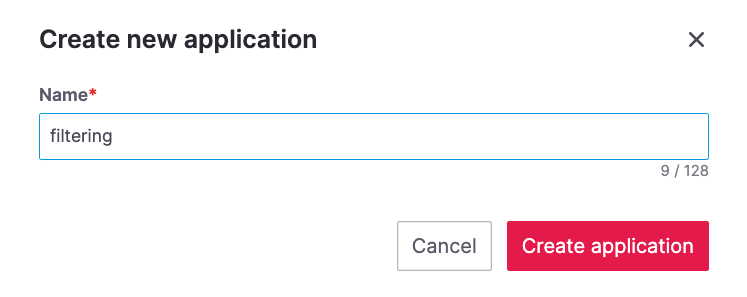
Create the first version of the application by clicking on Create first version button.
In the Add source tables tab, create the source table (named
CPU_IN), pointing to the Apache Kafka® topiccpu_load_stats_realwhere the IoT sensor readings are stored by:Select
Aiven for Apache Kafka - demo-kafkaas Integrated service.Paste the following SQL:
CREATE TABLE CPU_IN (
    hostname STRING,
    cpu STRING,
    usage DOUBLE,
    occurred_at BIGINT,
    time_ltz AS TO_TIMESTAMP_LTZ(occurred_at, 3),
    WATERMARK FOR time_ltz AS time_ltz - INTERVAL '10' SECOND
    )
WITH (
   'connector' = 'kafka',
   'properties.bootstrap.servers' = '',
   'topic' = 'cpu_load_stats_real',
   'value.format' = 'json',
   'scan.startup.mode' = 'earliest-offset'
)
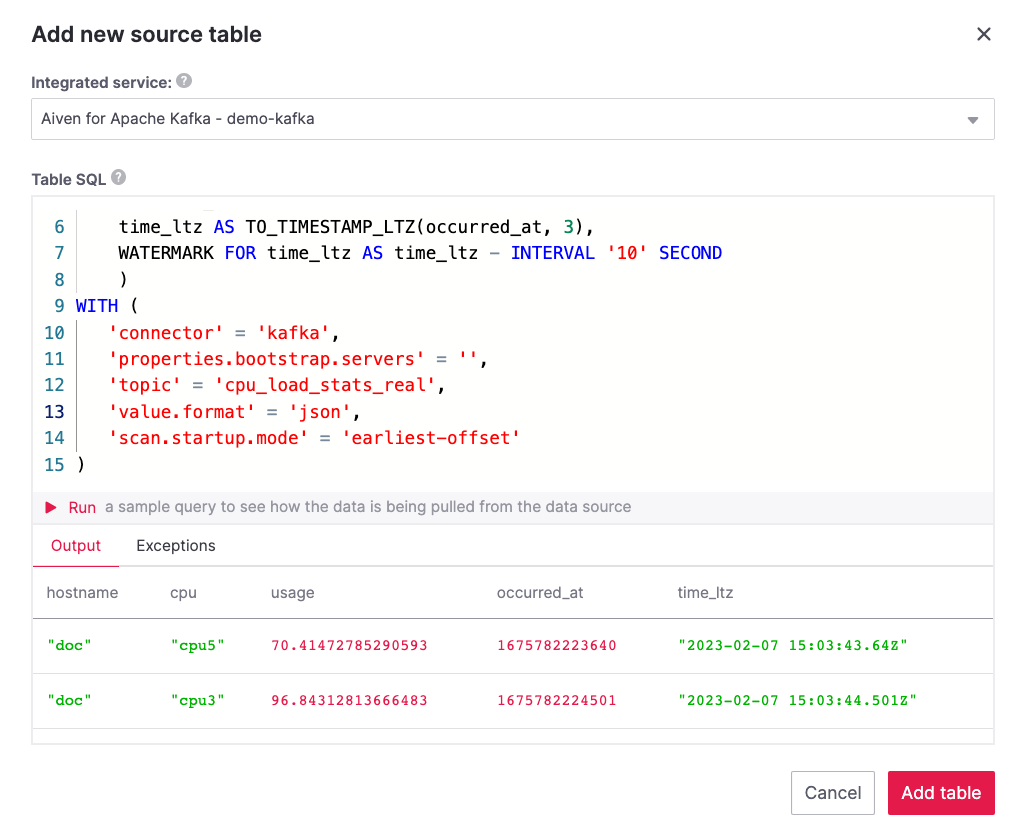
Once created, the source table tab should look like the following:
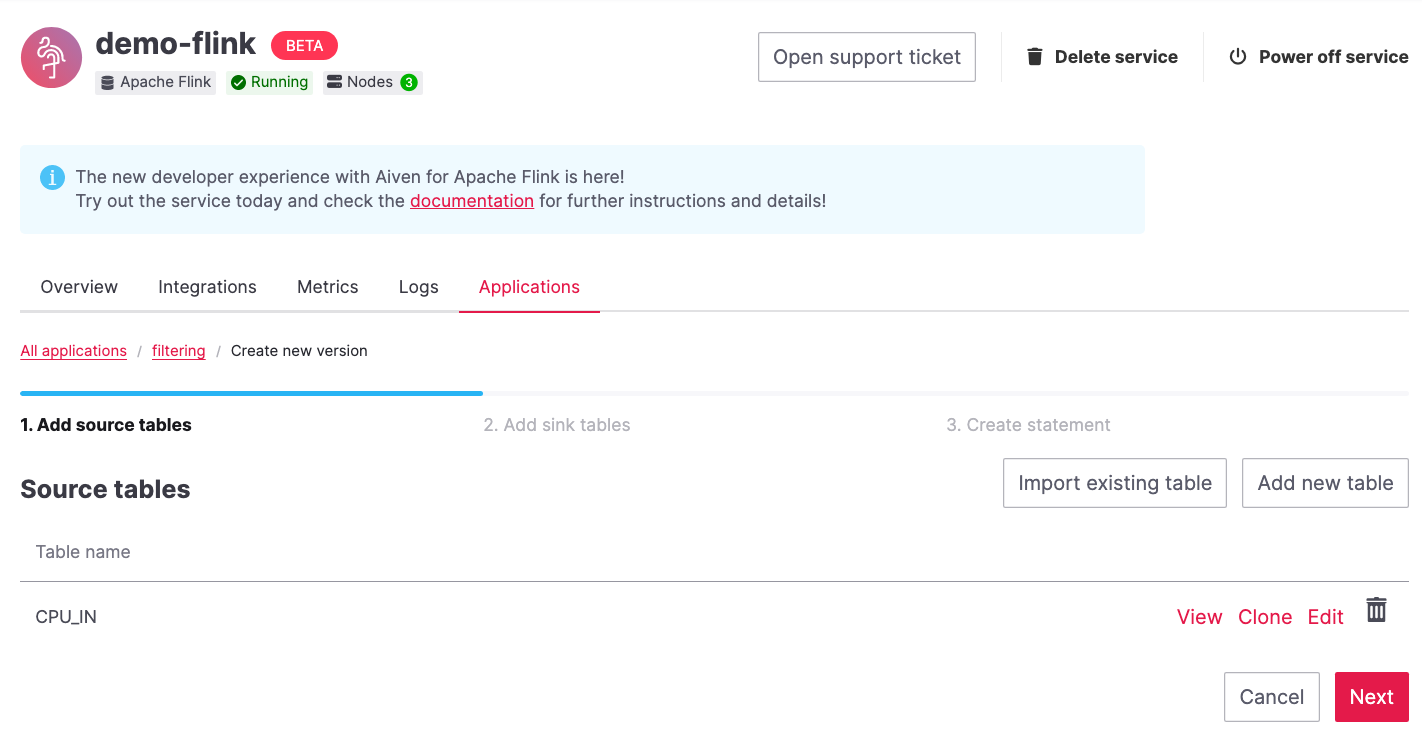
Before saving the source table definition, you can check if it matches the data in the topic by clicking on the triangle next to Run. You should see the populated data.
Navigate to the Add sink table tab.
Create the sink table (named
CPU_OUT_FILTER), pointing to a new Apache Kafka® topic namedcpu_load_stats_real_filterwhere the readings exceeding the80%threshold will land, by:Clicking on the Add your first sink table.
Selecting
Aiven for Apache Kafka - demo-kafkaas Integrated service.Pasting the following SQL:
CREATE TABLE CPU_OUT_FILTER (
    time_ltz TIMESTAMP(3),
    hostname STRING,
    cpu STRING,
    usage DOUBLE
    )
WITH (
   'connector' = 'kafka',
   'properties.bootstrap.servers' = '',
   'topic' = 'cpu_load_stats_real_filter',
   'value.format' = 'json',
   'scan.startup.mode' = 'earliest-offset'
)
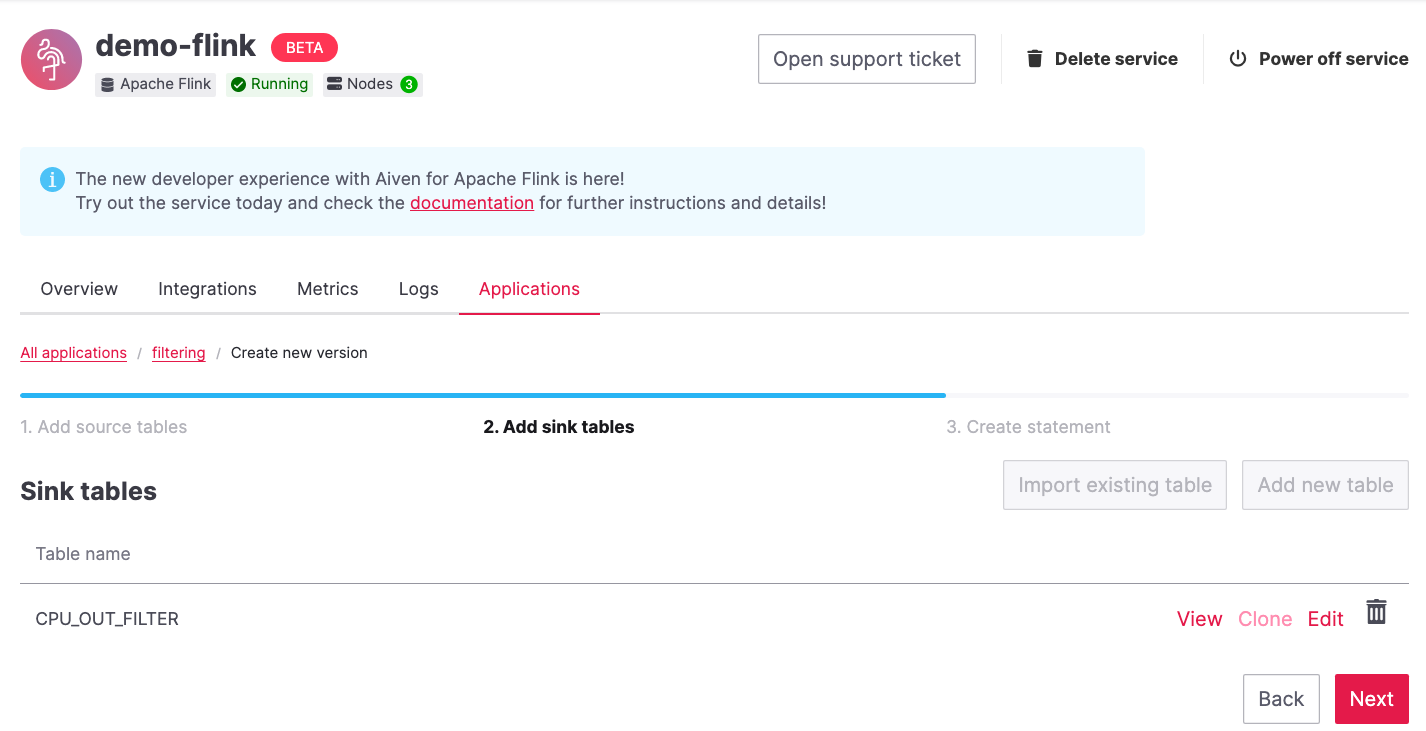
Once created, the sink table tab should look like the following:
Navigate to the Create statement tab.
Enter the following as the transformation SQL statement, taking data from the
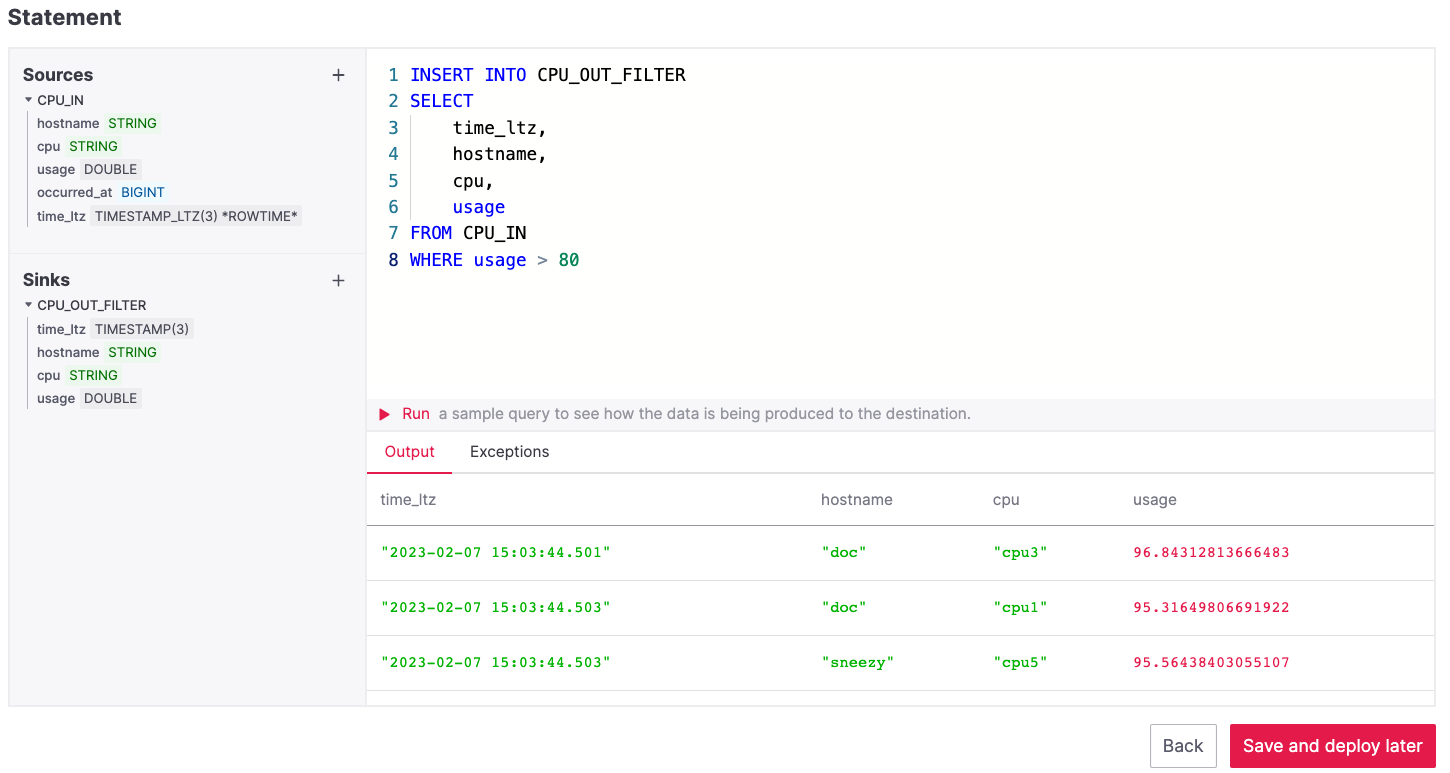
CPU_INtable and pushing the samples over the80%threshold toCPU_OUT_FILTER:INSERT INTO CPU_OUT_FILTER SELECT time_ltz, hostname, cpu, usage FROM CPU_IN WHERE usage > 80
If you’re curious, you can preview the output of the transformation by clicking on the triangle next to the Run section, the Create statement window should be similar to the following image.
Click Save and deploy later.
Click Create deployment.
Accept the default deployment parameters and click on Deploy without a savepoint.
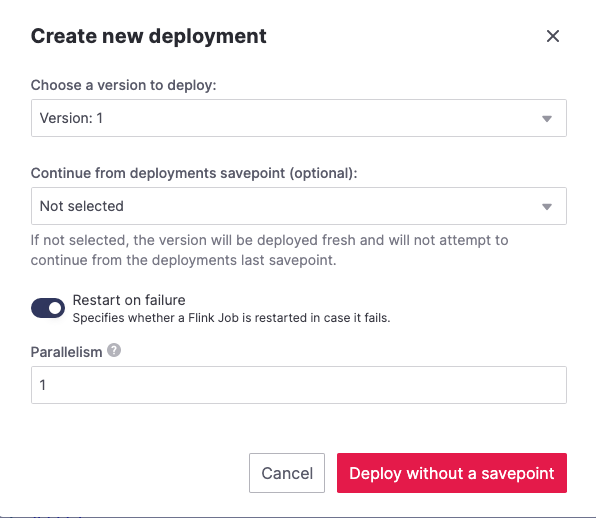
The new application deployment status will show Initializing and then Running: version 1.
Once the application is running, you should start to see messages indicating hosts with high CPU loads in the cpu_load_stats_real_filter topic of your demo-kafka Apache Kafka service.
Important
Congratulations! You created your first streaming anomaly detection pipeline!
The data is now available in the Apache Kafka topic named cpu_load_stats_real_filter, from there you could either write your own Apache Kafka consumer to read the high sensor records or use Kafka Connect to sink the data to a wide range of technologies.
Evolve the anomaly detection pipeline with windowing and threshold lookup#
In most production environments, you wouldn’t want to send an alert on every measurement above the threshold. Sometimes CPUs spike momentarily, for example, and come back down in usage milliseconds later. What’s really useful to you in production is if a CPU spike is sustained over a certain period of time.
If a CPU usage spike happens continuously for a 30 seconds interval, there might be a problem. In this step, you’ll aggregate the CPU load over a configured time using windows and the event time. By averaging the CPU values over a time window you can filter out short term spikes in usage, and flag only anomaly scenarios where the usage is consistently above a pre-defined threshold for a long period of time.
To add a bit of complexity, and mimic a real scenario, we’ll also move away from a fixed 80% threshold, and compare the average utilization figures with the different thresholds, set in a reference table (stored in PostgreSQL), for the various IoT devices based on their hostname. Every IoT device is different, and various devices usually have different alerting ranges. The reference table provides an example of variable, device dependent, thresholds.
Create the windowing pipeline#
In this step, you’ll create a pipeline to average the CPU metrics figures in 30 seconds windows. Averaging the metric over a time window allows to avoid notification for temporary spikes.
Note
In this section, you will be able to reuse CPU_IN source table definition created previously. Importing a working table definition, rather than re-defining it, is a good practice to avoid mistakes.
To complete the section, you will perform the following steps:
Create a new Aiven for Apache Flink application.
Import the previously created
CPU_INsource table to read the metrics data from your Apache Kafka® topic.Define a sink table to send the processed messages to a separate Apache Kafka® topic.
Define a SQL transformation definition to process the data.
Create an application deployment to execute the pipeline.
You can go ahead an try yourself to define the windowing pipeline. If, on the other side, you prefer a step by step approach, follow the instructions below:
In the Aiven Console, open the Aiven for Apache Flink service and go to the Applications tab.
Click on Create new application and name it
cpu_agg.Click on Create first version.
To import the source
CPU_INtable from the previously createdfilteringapplication:Click on Import existing source table
Select
filteringas application,Version 1as version,CPU_INas table and click NextClick on Add table
Navigate to the Add sink tables tab.
Create the sink table (named
CPU_OUT_AGG) pointing to a new Apache Kafka® topic namedcpu_agg_stats, where the 30 second aggregated data will land, by:Clicking on the Add your first sink table.
Selecting
Aiven for Apache Kafka - demo-kafkaas Integrated service.Pasting the following SQL:
CREATE TABLE CPU_OUT_AGG(
    window_start TIMESTAMP(3),
    window_end TIMESTAMP(3),
    hostname STRING,
    cpu STRING,
    usage_avg DOUBLE,
    usage_max DOUBLE
    )
WITH (
   'connector' = 'kafka',
   'properties.bootstrap.servers' = '',
   'topic' = 'cpu_agg_stats',
   'value.format' = 'json',
   'scan.startup.mode' = 'earliest-offset'
)
Click Add table.
Navigate to the Create statement tab.
Enter the following as the transformation SQL statement, taking data from the
CPU_INtable, aggregating the data over a 30 seconds window, and pushing the output toCPU_OUT_AGG:INSERT INTO CPU_OUT_AGG SELECT window_start, window_end, hostname, cpu, AVG(usage), MAX(usage) FROM TABLE( TUMBLE( TABLE CPU_IN, DESCRIPTOR(time_ltz), INTERVAL '30' SECONDS)) GROUP BY window_start, window_end, hostname, cpu
Click Save and deploy later.
Click Create deployment.
Accept the default deployment parameters and click on Deploy without a savepoint.
The new application deployment status will show Initializing and then Running: version 1.
When the application is running, you should start to see messages containing the 30 seconds CPU average in the cpu_agg_stats topic of your demo-kafka service.
Create a threshold table in PostgreSQL#
You will use a PostgreSQL table to store the various IoT thresholds based on the hostname. The table will later be used by a Flink application to compare the average CPU usage with the thresholds and send the notifications to a Slack channel.
You can create the thresholds table in the demo-postgresql service with the following steps:
Note
The below instructions assume psql is installed in your local machine.
In the Aiven Console, open the Aiven for PostgreSQL service
demo-postgresql.In the Overview tab locate the Service URI parameter and copy the value.
Connect via
psqltodemo postgresqlwith the following terminal command, replacing the<SERVICE_URI>placeholder with the Service URI string copied in the step above:psql "<SERVICE_URI>"
Create the
cpu_thresholdstable and populate the values with the following code:CREATE TABLE cpu_thresholds ( hostname VARCHAR, allowed_top INT ); INSERT INTO cpu_thresholds VALUES ('doc', 20), ('grumpy', 30), ('sleepy',40), ('bashful',60), ('happy',70), ('sneezy',80), ('dopey',90);
Enter the following command to check that the threshold values are correctly populated:
SELECT * FROM cpu_thresholds;
The output shows you the content of the table:
hostname | allowed_top
---------+------------
doc      |     20
grumpy   |     30
sleepy   |     40
bashful  |     60
happy    |     70
sneezy   |     80
dopey    |     90
Create the notification pipeline comparing average CPU data with the thresholds#
At this point, you should have both a stream of the 30 seconds average CPU metrics coming from Apache Kafka, and a set of “per-device” thresholds stored in the PostgreSQL database. This section showcases how you can compare the usage with the thresholds and send a slack notification identifying anomaly situations of when the usage is exceeding the thresholds.
You can complete the section with the following steps:
Create a new Aiven for Apache Flink application.
Create a source table to read the aggregated metrics data from your Apache Kafka® topic.
Define a sink table to send the processed messages to a separate Slack channel.
Define a SQL transformation definition to process the data.
Create an application deployment to execute the pipeline.
To create the notification data pipeline, you can go ahead an try yourself or follow the steps below:
In the Aiven Console, open the Aiven for Apache Flink service and go to the Applications tab.
Click on Create new application and name it
cpu_notification.Click on Create first version.
To create a source table
CPU_IN_AGGpointing to the Apache Kafka topiccpu_agg_stats:Click on Add your first source table.
Select
Aiven for Apache Kafka - demo-kafkaas Integrated service.Paste the following SQL:
CREATE TABLE CPU_IN_AGG(
    window_start TIMESTAMP(3),
    window_end TIMESTAMP(3),
    hostname STRING,
    cpu STRING,
    usage_avg DOUBLE,
    usage_max DOUBLE
    )
WITH (
   'connector' = 'kafka',
   'properties.bootstrap.servers' = '',
   'topic' = 'cpu_agg_stats',
   'value.format' = 'json',
   'scan.startup.mode' = 'earliest-offset'
)
Click Add table.
To create a source table
CPU_THRESHOLDSpointing to the PostgreSQL tablecpu_thresholds:Click on Add new table.
Select
Aiven for PostgreSQL - demo-postgresqlas Integrated service.Paste the following SQL:
CREATE TABLE CPU_THRESHOLDS(
    hostname STRING,
    allowed_top INT,
    PRIMARY KEY (hostname) NOT ENFORCED
    )
WITH (
    'connector' = 'jdbc',
    'url' = 'jdbc:postgresql://',
    'table-name' = 'public.cpu_thresholds'
)
Click Add table.
Navigate to the Add sink tables tab.
To create a sink table
SLACK_SINKpointing to a Slack channel for notifications:Click on Add your first sink table.
Select No integrated service as Integrated service.
Paste the following SQL, replacing the
<SLACK_TOKEN>placeholder with the Slack authentication token:create table SLACK_SINK ( channel_id STRING, message STRING ) WITH ( 'connector' = 'slack', 'token' = '$SLACK_TOKEN' )
Navigate to the Create statement tab.
Enter the following as the transformation SQL statement, taking data from the
CPU_IN_AGGtable, comparing it with the threshold values fromCPU_THRESHOLDSand pushing the samples over the threshold toSLACK_SINK:INSERT INTO SLACK_SINK SELECT '$CHANNEL_ID', 'host:' || CPU.hostname || ' CPU: ' || cpu || ' avg CPU value:' || TRY_CAST(usage_avg as string) || ' over the threshold ' || TRY_CAST(allowed_top as string) FROM CPU_IN_AGG CPU INNER JOIN CPU_THRESHOLDS ON CPU.hostname = CPU_THRESHOLDS.hostname WHERE usage_avg > allowed_top
Note
The
<CHANNEL_ID>placeholder needs to be replaced by the Slack channel ID parameter.Click Save and deploy later.
Click Create deployment.
Accept the default deployment parameters and click on Deploy without a savepoint.
The new application deployment status will show Initializing and then Running: version 1.
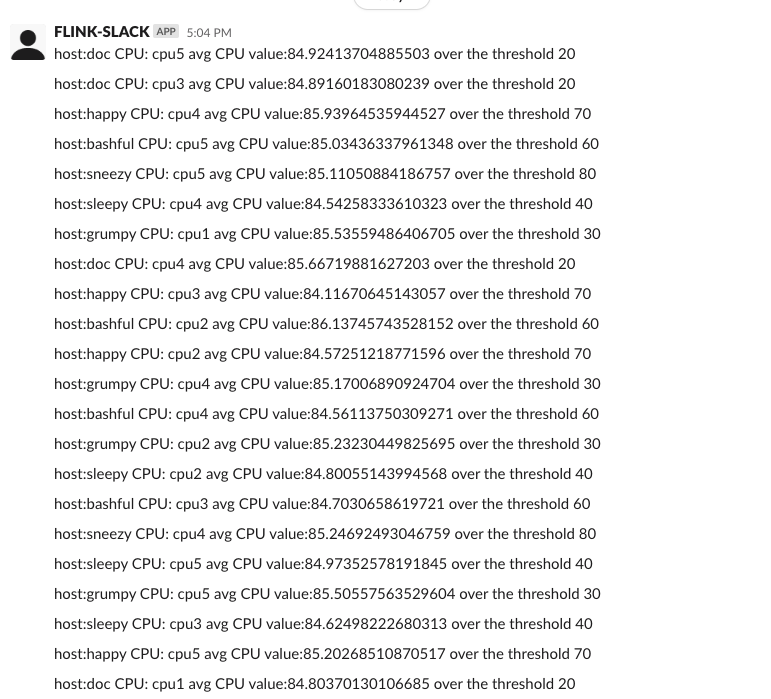
When the application is running, you should start to see notifications about the IoT devices having CPU usage going over the defined thresholds in the Slack channel.
Important
Congratulations! You created an advanced streaming data pipeline including windowing, joining data coming from different technologies and a Slack notification system

